The ETF Fee Nobody Shows You (It's Bigger Than the Expense Ratio)
The Hidden Cost of ETFs
Nobody Talks About
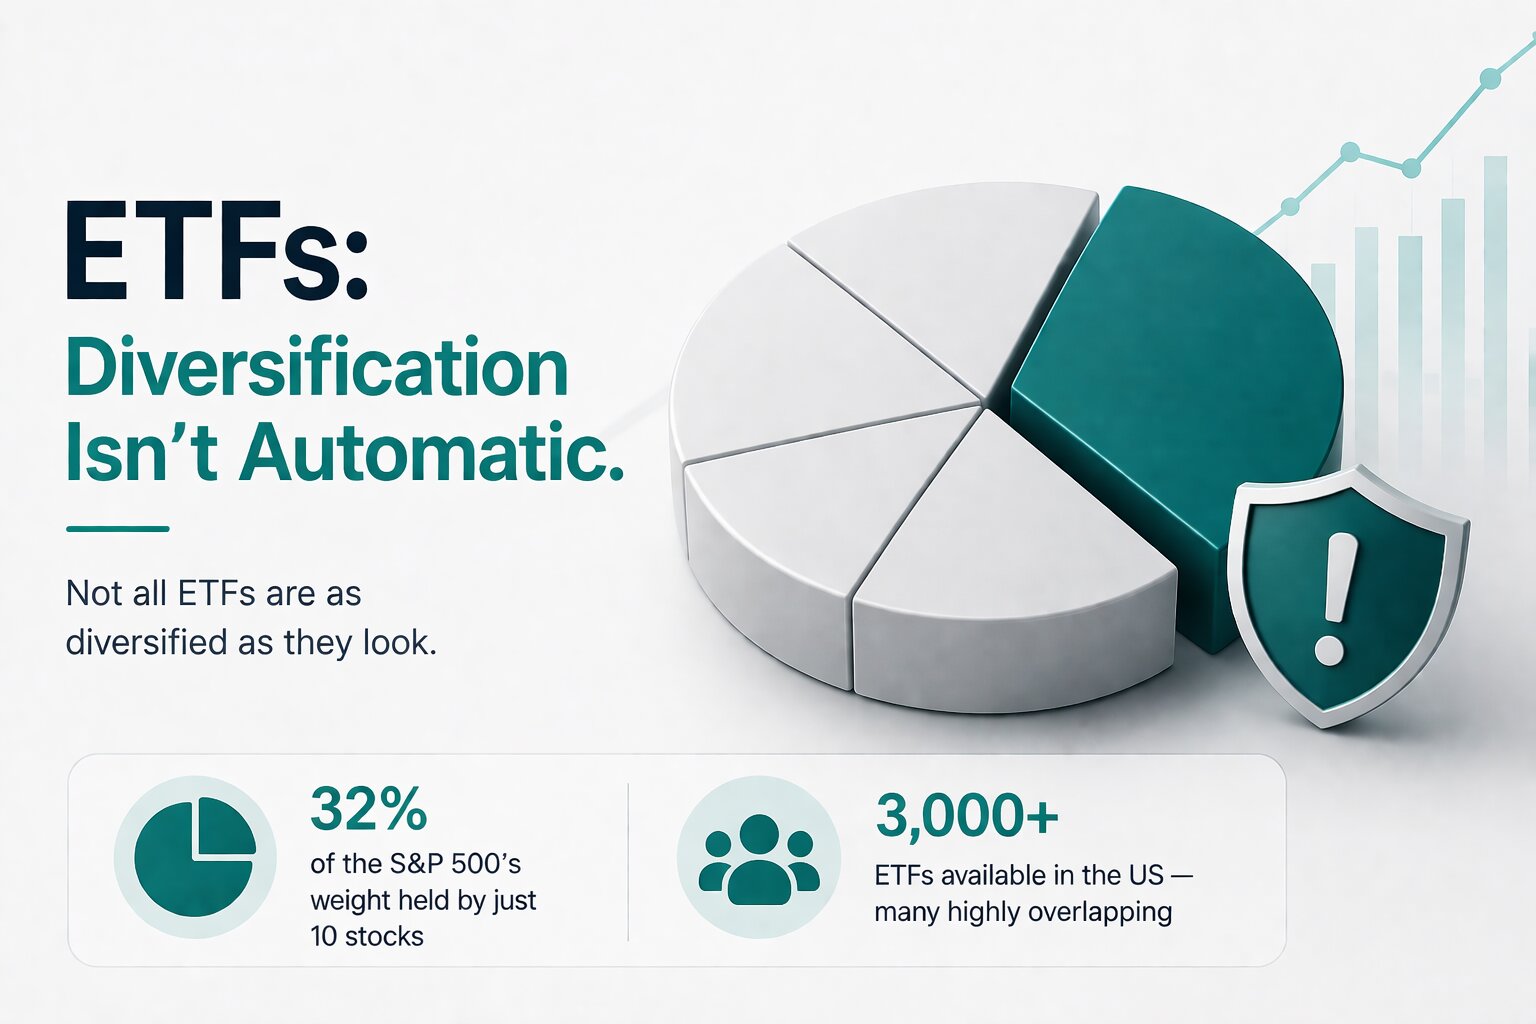
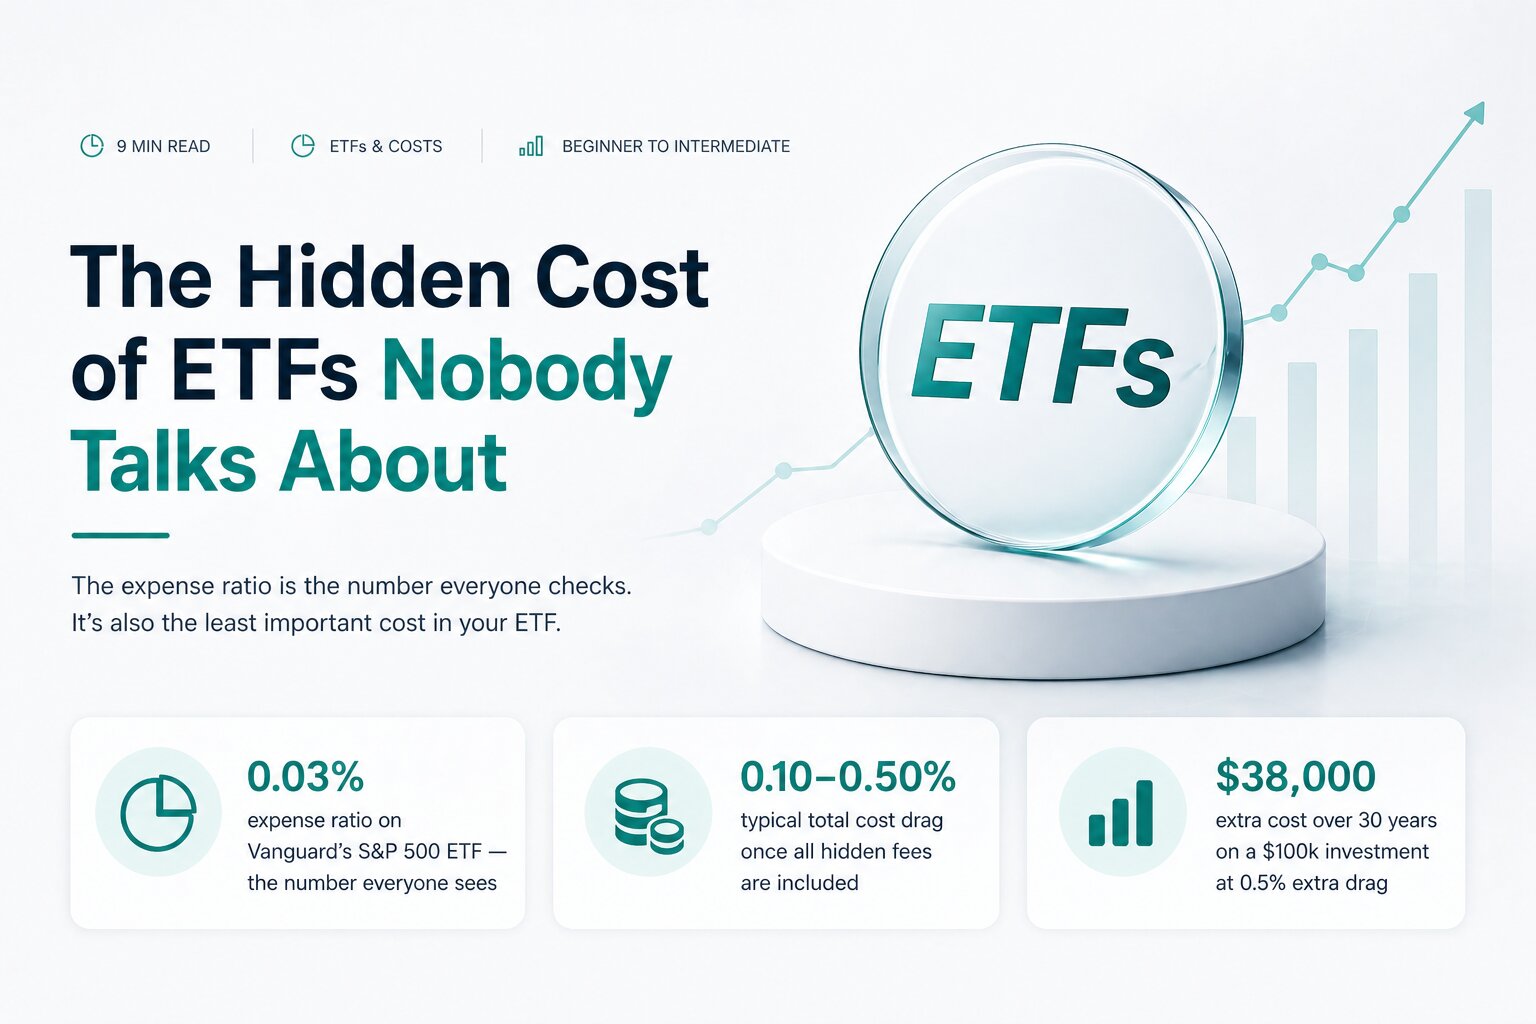
The expense ratio is the number everyone checks. It's also the least important cost in your ETF. Here's what's actually draining your returns.
The ETF industry's greatest marketing achievement isn't the product itself — it's convincing millions of investors that the expense ratio is the only cost that matters. Check the expense ratio, compare it to a benchmark, pick the cheapest one. Done.
This is not wrong, exactly. Expense ratios do matter, and low-cost index ETFs have genuinely saved retail investors billions in fees compared to the active fund industry they replaced. But the obsessive focus on expense ratios has created a blind spot. It's let a set of real, meaningful costs hide in the background — costs that show up not as line items on your statement, but as the quiet, compounding gap between what the index returned and what you actually got.
There are four of them. Most investors have heard of at most two. All four matter, and together they can add up to far more than the headline fee you were watching.
Cost #1: Tracking error — the gap nobody measures
An ETF's job is to replicate the performance of its benchmark index as closely as possible. Tracking error is the measure of how well — or poorly — it actually does that job.
You might assume that an ETF tracking the S&P 500 simply returns whatever the S&P 500 returns, minus the expense ratio. In reality, it's more complicated. The fund has to buy and sell securities when the index is rebalanced. It has to manage cash flows from dividends and investor inflows. It pays transaction costs on all of those trades. It may not be able to hold every security in the index with perfect weighting at every moment.
The result is that every ETF has some degree of tracking error — a persistent small difference between the fund's actual returns and the index it claims to track. For the largest, most liquid index ETFs, this gap is tiny — often just a few basis points. But for smaller ETFs, international funds, fixed income ETFs, or any fund tracking an illiquid or complex index, tracking error can be 0.3%, 0.5%, or more per year.
"You're paying for index returns. Tracking error is the tax on imperfect execution."
This cost is invisible in marketing materials. The expense ratio is disclosed prominently. Tracking error requires you to go and look it up — comparing the fund's actual historical returns against the index total return, not just the fund's stated benchmark return. Most investors never do this. They should.
Cost #2: The bid-ask spread — every trade has a toll
Unlike mutual funds, which are priced once per day at net asset value, ETFs trade on exchanges throughout the day like stocks. This creates a structural cost that mutual fund investors never face: the bid-ask spread.
At any given moment, there's a price you can buy an ETF for (the ask) and a slightly lower price you can sell it for (the bid). The difference between them is the spread, and it represents an immediate loss the moment you execute any trade. For highly liquid ETFs like SPY or QQQ, this spread is typically just one or two cents — essentially negligible. For smaller, less liquid ETFs, it can be 0.1%, 0.3%, or more.
The spread compounds in a specific way that catches investors off guard: if you're making regular contributions — buying monthly, for example — you pay the spread every single time. A buy-and-hold investor who makes twelve monthly purchases and eventually sells pays the spread thirteen times. That's thirteen small tolls on the same road.
Estimates based on representative ETF categories. Actual costs vary by fund, trading frequency, and tax situation.
Cost #3: Tax drag — the most expensive cost of all
In a taxable account, tax drag is almost certainly your largest ETF cost — and it's the one the industry talks about the least, because it's the most complicated and the most investor-specific.
ETFs are generally more tax-efficient than mutual funds, thanks to a structural feature called the in-kind creation/redemption mechanism that allows them to purge embedded capital gains in a way mutual funds can't. This is a genuine, meaningful advantage. But it doesn't eliminate tax drag — it just reduces one dimension of it.
The costs that remain are significant. Dividends paid by ETFs are typically taxable in the year received — regardless of whether you reinvest them or not. For a fund yielding 1.5% in a 30% tax bracket, that's 0.45% of your portfolio going to taxes every year before you've done anything. This is the drag that quietly erodes the power of compounding over decades.
Rebalancing creates additional taxable events. If you hold multiple ETFs and periodically rebalance your portfolio back to target weights, every sale of an appreciated position realises a capital gain that you'll owe tax on. Even the ETF itself can generate capital gains distributions in certain circumstances — particularly in rising rate environments where bond ETFs are forced to sell positions.
"In a taxable account, your real after-tax return is often 0.5–1% lower than the fund's stated return — every year."
Cost #4: Premiums and discounts — buying at the wrong price
Because ETFs trade on exchanges, their market price can — and does — deviate from the underlying value of the securities they hold. When the market price is above the net asset value, the ETF trades at a premium. When below, at a discount.
For the largest, most actively traded ETFs, this deviation is typically tiny and corrected within seconds by arbitrage mechanisms. But in less liquid funds — niche bond ETFs, international ETFs where the underlying markets are closed, small thematic funds — premiums and discounts can be substantial and persistent.
The damage happens in two specific moments. Investors who buy during a period of elevated premium are paying more than the fund's assets are worth. If that premium compresses back to zero — which it eventually does — they've taken an immediate loss that has nothing to do with the underlying securities. And investors who sell during a discount receive less than the fund is worth. Both situations happen most often during periods of market stress — again, exactly when you're most likely to be making emotional decisions about your portfolio.
| Cost type | Visibility | Typical range | Who pays most |
|---|---|---|---|
| Expense ratio | High — disclosed prominently | 0.03–0.75% | All investors equally |
| Tracking error | Low — requires research | 0.02–0.50% | Investors in smaller/niche ETFs |
| Bid-ask spread | Low — visible only at trade | 0.01–0.30% per trade | Frequent traders, illiquid ETFs |
| Tax drag | Very low — requires modelling | 0.30–1.00%+ annually | Taxable account holders |
| Premium/discount | Low — visible at trade time | 0.00–0.50% at entry/exit | Investors in illiquid/niche ETFs |
The 30-year compounding problem
None of these costs look large in isolation. A 0.1% tracking error here, a 0.3% tax drag there — it's easy to dismiss as rounding error. The compounding math tells a different story.
An investor who puts $100,000 into an ETF that returns 8% annually but faces a total cost drag of 0.5% — tracking error plus spread plus tax drag — ends up with roughly $38,000 less after 30 years than an investor in an otherwise identical fund with zero hidden costs. That's not a theoretical number. It's real money that left your account silently, one basis point at a time, for three decades.
Illustrative compounding model. Assumes constant 8% gross return, annual compounding, costs applied as annual drag.
How to minimise what you can't see
True cost analysis across your ETF holdings
Tirnu surfaces tracking difference, average spread cost, and estimated tax drag for each ETF in your portfolio — not just the headline expense ratio. See your real cost of ownership before you buy, not after.
The expense ratio is the starting point of ETF cost analysis. It is not the end of it.
Track what the fund actually returned versus what its index returned. Understand what you're paying at the bid-ask on each trade. Account for dividend tax drag if you're in a taxable account. These numbers are less convenient to find than the expense ratio, which is exactly why the industry has trained you to stop looking after you find it.
See your real ETF costs with Tirnu
Tracking difference, spread analysis, and tax drag modelling — everything the expense ratio isn't telling you.
Explore Tirnu's Cost Tools